
Quick Answer
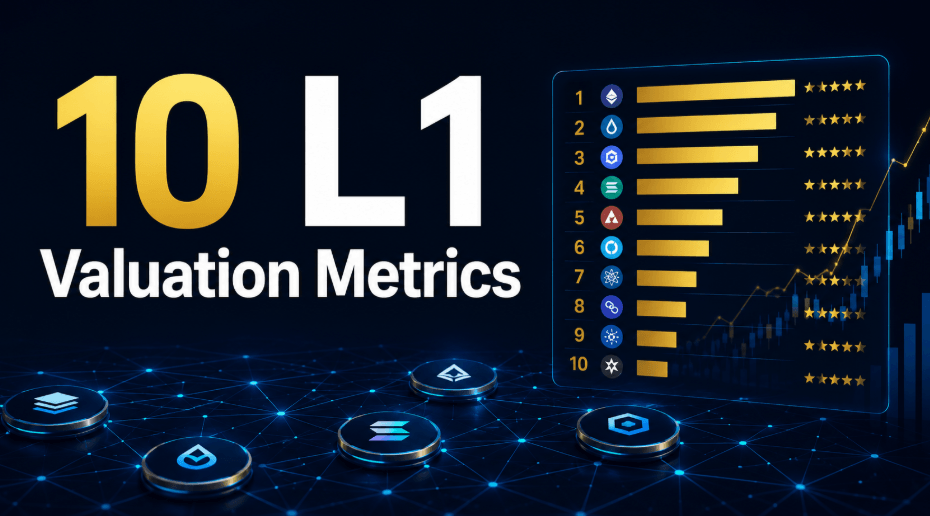
There is no single reliable metric for valuing a Layer-1 (L1) token. The strongest approach combines network economics, user demand, token value capture, supply dilution, security spending, and ecosystem health, then checks whether the resulting market cap is justified relative to comparable networks. Below are the 10 metrics that matter most, weighted into a 100-point scorecard.
Three questions sit under every metric: is the network economically useful and growing (network quality); does that activity create demand for the native token (token quality); and is the current market cap justified by those fundamentals (valuation)?
Key Takeaways
- Value the network first, the token second, and its market price third.
- Token value capture and fee generation carry the most weight, since network usage doesn’t automatically benefit token holders.
- Wallet counts, TVL, and TPS are the most commonly misused L1 statistics.
- A low token price means nothing without market cap, FDV, and unlock schedules.
- Compare networks using trailing 30- and 90-day data, not lifetime totals.
How Should You Value a Layer-1 Blockchain Token?
Value the network first, the token second, and its market price third. Skipping to price or market cap is the most common mistake investors make with L1s. A simple three-stage framework: measure network demand (users, fees, liquidity), then token economics (value capture, dilution, security cost), then fundamentals versus valuation (market cap, FDV, peer multiples). For example, the CORE coin price can serve as one market input in this process, but it should be assessed alongside network usage, fee generation, supply dynamics, security economics, and developer activity.
Raw scale alone is insufficient, a chain can process millions of transactions with little economic value behind them, or show high TVL that exists only because of token incentives. Compare L1s using consistent windows, ideally trailing 30-day, 90-day, and 12-month trends, rather than isolated daily figures.
What Are the 10 Most Important Layer-1 Crypto Valuation Metrics?
| Rank | Metric | Weight | Core question |
| 1 | Token value capture | 15% | Does network growth create demand for the token? |
| 2 | Network fees and revenue | 14% | Are users paying for blockspace? |
| 3 | Active users and retention | 12% | Is usage real and recurring? |
| 4 | Supply growth, unlocks and FDV | 11% | How much dilution remains? |
| 5 | Security budget and staking economics | 10% | Can the network sustainably pay for security? |
| 6 | Stablecoin liquidity and quality-adjusted TVL | 10% | Is meaningful capital staying on-chain? |
| 7 | Developer activity and application ecosystem | 9% | Is the ecosystem attracting builders? |
| 8 | Economic throughput | 8% | How much real value moves through the chain? |
| 9 | Validator and stake decentralization | 6% | How concentrated is network control? |
| 10 | Relative valuation multiples | 5% | How expensive are these fundamentals? |
1. Token value capture (15%)
A successful blockchain doesn’t automatically produce a successful token. Check whether the token is required for gas, staking, governance, collateral, burns, or buybacks. Treat announced burns differently from realized value capture, fees show what a network earns; value capture shows who benefits.
2. Network fees and revenue (14%)
Track monthly fees, annualized run-rate, and fees per active user. Token Terminal defines L1 fees as what users pay for transactions, a useful cross-chain signal. Fee growth alongside user growth is healthy; high fees can just mean congestion.
3. Active users and retention (12%)
Prioritize daily/monthly active addresses and cohort retention over cumulative counts. One address doesn’t equal one person, incentive farming and Sybil activity inflate wallet totals.
4. Supply growth, unlocks and FDV (11%)
Track circulating and max supply, issuance, upcoming unlocks, and market cap versus FDV. Ask: if fundamentals stay flat, how much additional demand is needed just to absorb new supply? Lower issuance reduces dilution but can weaken security if rewards fall too far.
5. Security budget and staking economics (10%)
Evaluate value committed to security, staking participation, and real yield after inflation. Hybrid models need adjustment: Core factors delegated Bitcoin hash power and Bitcoin staking alongside CORE staking into validator selection. A large security budget improves resilience but gets costly when funded mainly through inflation.
6. Stablecoin liquidity and quality-adjusted TVL (10%)
Never score raw TVL alone. Break it into stablecoin supply, organic versus incentive-driven capital, and retention once rewards taper. Mercenary liquidity vanishes as fast as it arrived, while persistent stablecoin liquidity suggests capital is genuinely staying on-chain. Use a standardized source like DeFiLlama and disclose what’s included.
7. Developer activity and application ecosystem (9%)
Track monthly active developers and applications with real users or revenue, trend matters more than raw repo counts. Electric Capital’s data notes many crypto developers contribute across multiple chains, so counts alone don’t indicate exclusive commitment.
8. Economic throughput (8%)
Look past TPS toward stablecoin transfer value, DEX volume, and settlement value. Core’s Rev+ framework weighs transactions, notional value, and fees together rather than transaction count alone. Wash trading and bots can inflate raw activity numbers.
9. Validator and stake decentralization (6%)
Look at validator count, stake concentration, and the largest validator’s share. Greater decentralization reduces capture risk. Some architectures deliberately run smaller validator sets for performance, so compare chains with similar designs.
10. Relative valuation multiples (5%)
Calculate these only after scoring fundamentals: Market Cap/Fees, FDV/Fees, and Market Cap/Stablecoin Supply are useful starting ratios. Compare against peers and the network’s own history, a low multiple isn’t automatically bullish; it may reflect shrinking usage.
Read more: 5 Ways Real Estate Leaders Build Strong Entrepreneur Partnerships
How Do You Build a 100-Point Layer-1 Valuation Scorecard?
Score each metric 0–5, then weight it: Weighted score = (Metric score ÷ 5) × Metric weight. A 5 means category-leading and verifiable; a 3 means competitive but mixed; a 0 means economically insignificant or unverifiable.
Sum the weighted scores out of 100: 80–100 strong fundamentals; 65–79 healthy with material weaknesses; 50–64 speculative; below 50 high fundamental risk.
The score alone doesn’t tell you whether a token is cheap, pair it with a simple matrix: strong fundamentals + low multiple suggests potential value; strong fundamentals + high multiple means a quality network that’s possibly expensive; weak fundamentals + low multiple can be a value trap; weak fundamentals + high multiple usually reflects a narrative premium. As a final overlay, apply liquidity risk, thin order books or reliance on very few venues should lower confidence even when fundamentals score well.
What Layer-1 Valuation Signals Are Most Often Misleading?
- Token price → assuming a low unit price is cheap. Use market cap and FDV instead.
- TVL → assuming locked capital is sticky. Check stablecoin share and incentive dependence.
- Active addresses → treating wallets as people. Check retention and fee generation.
- Transactions/TPS → assuming volume equals demand. Analyze settled value and fees.
- Staking APY → ignoring issuance. Calculate real yield after inflation.
- Roadmaps → pricing future value capture as current revenue. Count only realized results.
- Developer commits → assuming code activity equals adoption. Connect it to actual users.
Conclusion: Choosing How to Evaluate an L1 Token
No single number — price, TVL, transaction count, or market cap — tells you whether a Layer-1 token is fundamentally sound. The scorecard forces a sequence: assess real network demand, check whether that demand benefits token holders, account for dilution and security cost, and only then judge whether the market price is fair.
For a quick screen, start with the three highest-weighted metrics — token value capture, fees, and user retention — which account for 41% of the score and expose most weak networks fast. For deeper diligence, complete all ten categories and cross-check against valuation multiples.
FAQ
Which Layer-1 valuation metric matters most?
Token value capture and sustainable fee generation carry the highest weight, but neither should be judged apart from supply, users, and security spending.
Is TVL a reliable way to value an L1 token?
Not by itself. TVL becomes useful once combined with stablecoin liquidity, retention after incentives fade, and protocol concentration.
Should investors use market cap or FDV?
Both. Market cap reflects today’s circulating valuation; FDV shows the valuation investors could face as non-circulating supply enters the market.
